
analysis — notebook
Reactive
Live analysis, not a static export.
Adjust the inputs and everything downstream re-renders — the fit, the statistics, the figure. Freeze it when you're done and it carries an immutable hash and a full lineage trail.
- Prism-grade 4PL/curve-fits and statistics
- Two-tailed t-tests, ΔΔCt, EC50/IC50 built in
- .pzfx import so your history comes with you
Demo · Figure State Toggle
Figure is active. Modifications to raw file will automatically re-render.
1.2Ctrl
3.6Expt
p = 0.0799
Adjust dataset coordinates:
Control mean1.2 μM
Experimental mean3.6 μM
Power users
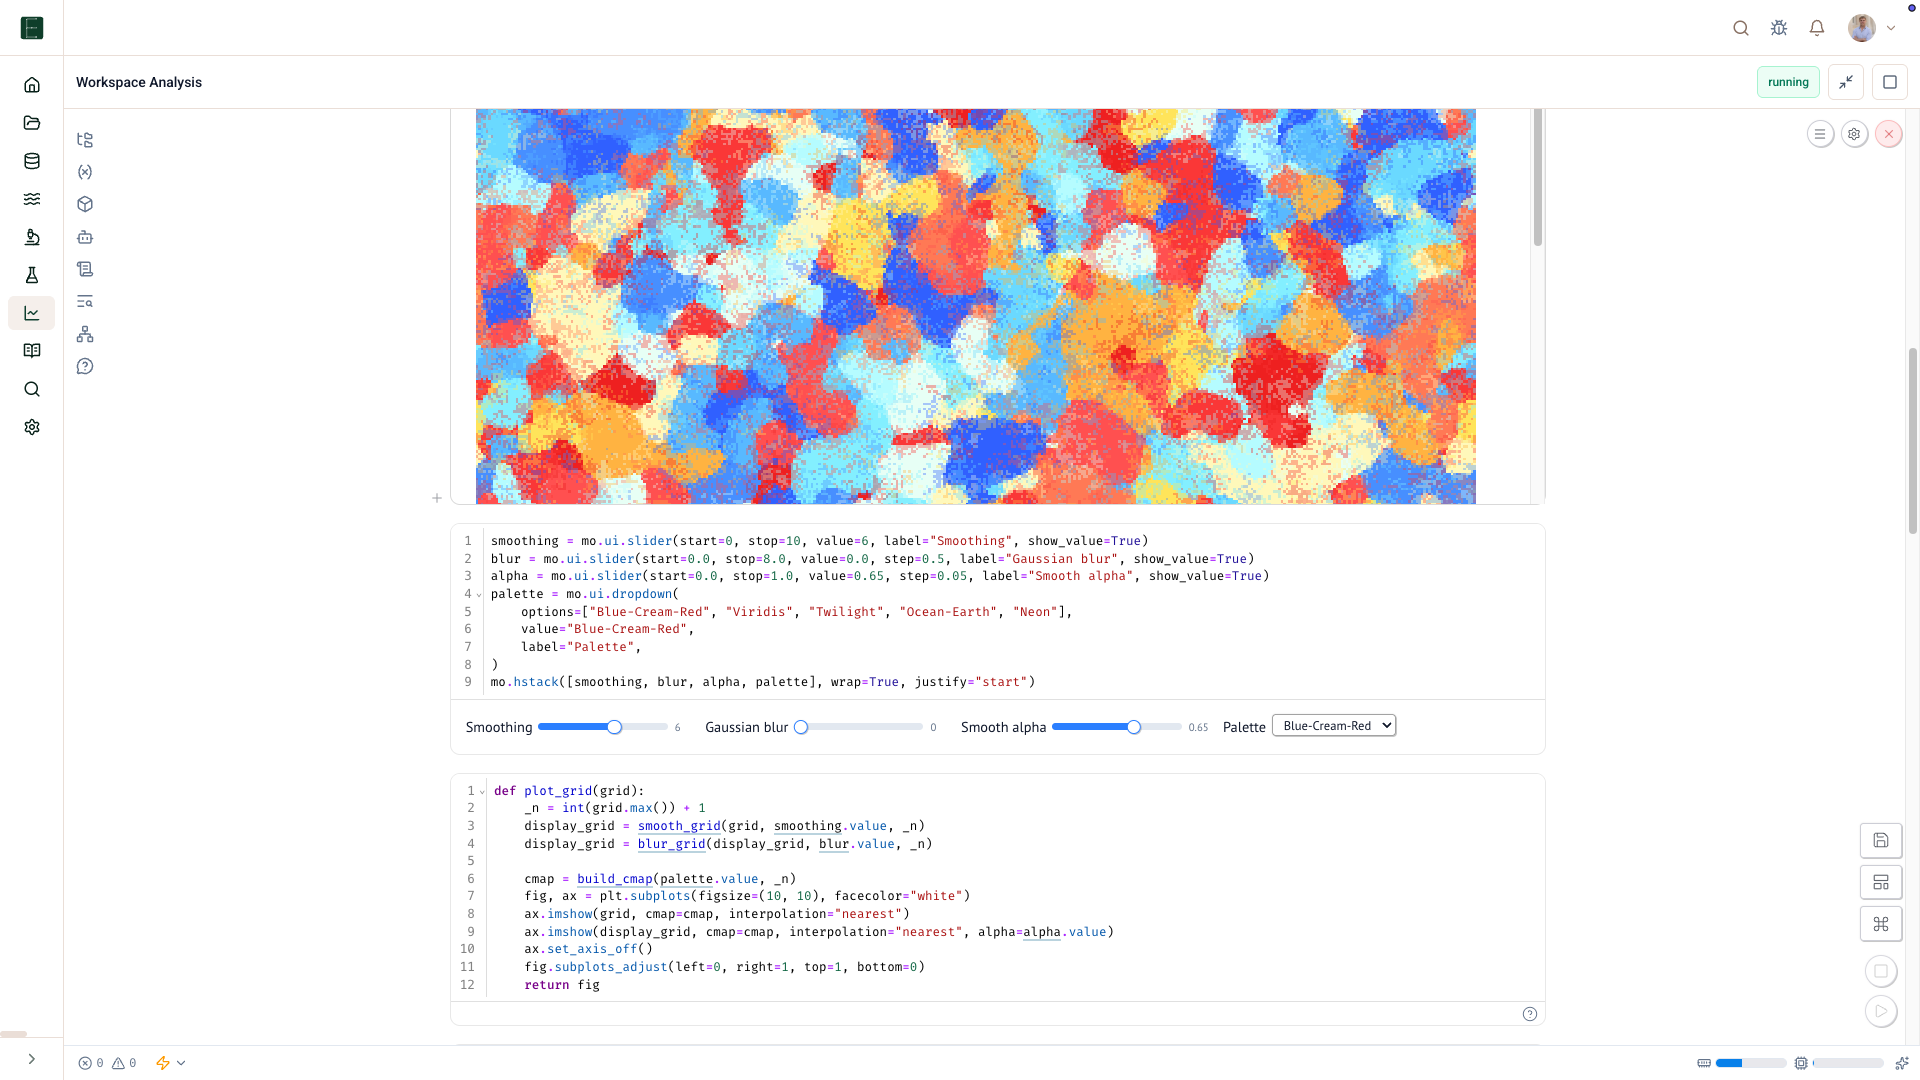
Drop into a Python notebook.
Every analysis can open as a reactive notebook on the same live data layer — full scientific Python, then save your script as a clean visual template the rest of your lab can run with no code.
- scipy, statsmodels, matplotlib — natively
- Runs against the same governed data layer
- Save a script as a no-code template for your lab
In [1]:
import epistabase as eb
In [2]:
df = eb.load("qPCR_plate3_export.csv").to_dataframe()
popt, _ = eb.fit_4pl(df['conc'], df['signal'])
print(f"EC50: {popt[2]:.3f} nM")
Out [2]:
EC50: 0.842 nM
Runs in a secure, containerized sandbox linked to your data lake origin.
Analyze without leaving your data.
Join the waitlist — we open in rolling cohorts, and members hear first.